Comparing NUTS, ADVI, full-rank ADVI and Pathfinder#
Fit exactly the same ARMA model and priors four ways. Compare parameter estimates, fit time, forecast time, CRPS and 90% interval coverage. No engine changes the model or sees the test observations during fitting.
This adapts the idea of Juan Orduz’s inference comparison
to the inference methods already supported by PyMC-Forecast. Install the extras
extra for Pathfinder. All four engines run in CI with reduced settings.
Prepare notebook#
import os
from time import perf_counter

import arviz as az
import matplotlib.pyplot as plt
import numpy as np
import pandas as pd
import pymc as pm
import xarray as xr

from pymc_forecast import (
    Forecaster,
    HMCForecaster,
    Horizon,
    PathfinderForecaster,
    evaluate_forecast,
    ssoe,
)

SMOKE = os.getenv("PYMC_FORECAST_SMOKE_TEST") == "1"
SEED = 2026
rng = np.random.default_rng(SEED)
DRAWS, TUNE, CHAINS = (25, 25, 1) if SMOKE else (600, 800, 2)
N_PRED = 50 if SMOKE else 800
HDI_PROB = 0.94

az.style.use("arviz-darkgrid")
if "stats.ci_kind" in az.rcParams:  # ArviZ 1.x; ArviZ 0.x intervals are always HDI
    az.rcParams["stats.ci_kind"] = "hdi"
az.rcParams["stats.ci_prob"] = HDI_PROB
plt.rcParams["figure.figsize"] = [10, 6]
plt.rcParams["figure.dpi"] = 100
plt.rcParams["figure.facecolor"] = "white"

%config InlineBackend.figure_format = "retina"
print(
    "Execution mode:", "CI smoke check; do not interpret fit quality" if SMOKE else "full example"
)
Execution mode: full example
Fit all four engines#
HMCForecaster, Forecaster, and PathfinderForecaster call the functional fitters fit_mcmc, fit_vi, and fit_pathfinder; the same options work with either API.
These timings include model building and compilation. They are one run on one machine, not a hardware-independent benchmark; compilation caches and execution order can affect the comparison. NUTS diagnostics apply to its actual chains. Approximation draws from ADVI and Pathfinder must not be interpreted as MCMC chains.
steps = 100 if SMOKE else 30000
specs = {
    "NUTS": (
        HMCForecaster,
        {"draws": DRAWS, "tune": TUNE, "chains": CHAINS, "sample_kwargs": {"target_accept": 0.9}},
    ),
    "ADVI": (Forecaster, {"num_steps": steps, "optimizer": 0.005}),
    "Full-rank ADVI": (
        Forecaster,
        {"method": "fullrank_advi", "num_steps": steps, "optimizer": 0.005},
    ),
    "Pathfinder": (
        PathfinderForecaster,
        {
            "pathfinder_kwargs": {
                "num_paths": 2 if SMOKE else 4,
                "num_draws": N_PRED,
                "num_draws_per_path": 100 if SMOKE else 500,
                "cores": 1,
            }
        },
    ),
}
fits, forecasts, posteriors, rows = {}, {}, {}, []
for i, (name, (cls, options)) in enumerate(specs.items()):
    start = perf_counter()
    fit = cls(arma_model, train, random_seed=SEED + i, progressbar=False, **options)
    fit_seconds = perf_counter() - start
    posterior = fit.draw_posterior(N_PRED, random_seed=SEED + 20 + i)
    start = perf_counter()
    samples = fit.forecast(
        horizon=horizon, posterior=posterior, random_seed=SEED + 30 + i
    ).predictions.forecast
    forecast_seconds = perf_counter() - start
    fits[name], forecasts[name], posteriors[name] = fit, samples, posterior
    assert samples.dims == ("chain", "draw", "time_future")
    rows.append(
        {
            "method": name,
            "fit_seconds": fit_seconds,
            "forecast_seconds": forecast_seconds,
            **evaluate_forecast(samples, truth),
        }
    )
pd.DataFrame(rows).set_index("method").round(3)
Initializing NUTS using jitter+adapt_diag...
Multiprocess sampling (2 chains in 2 jobs)
NUTS: [phi, theta, sigma]
Sampling 2 chains for 800 tune and 600 draw iterations (1_600 + 1_200 draws total) took 1 seconds.
We recommend running at least 4 chains for robust computation of convergence diagnostics
Sampling: [eps_future]
Finished [100%]: Average Loss = 86.007
Sampling: [eps_future]
Finished [100%]: Average Loss = 85.88
Sampling: [eps_future]
Sampling: [eps_future]
| fit_seconds | forecast_seconds | mae | rmse | crps | coverage | |
|---|---|---|---|---|---|---|
| method | ||||||
| NUTS | 9.229 | 0.240 | 0.554 | 0.710 | 0.402 | 0.875 |
| ADVI | 3.769 | 0.138 | 0.550 | 0.714 | 0.403 | 0.875 |
| Full-rank ADVI | 3.513 | 0.106 | 0.567 | 0.713 | 0.405 | 0.875 |
| Pathfinder | 2.471 | 0.097 | 0.551 | 0.698 | 0.396 | 0.875 |
Parameter estimates and diagnostics#
parameter_means = pd.DataFrame(
    {
        name: {v: float(posterior[v].mean()) for v in ["phi", "theta", "sigma"]}
        for name, posterior in posteriors.items()
    }
)
parameter_means["simulation_truth"] = [phi_true, theta_true, sigma_true]
parameter_means
| NUTS | ADVI | Full-rank ADVI | Pathfinder | simulation_truth | |
|---|---|---|---|---|---|
| phi | 0.687089 | 0.689719 | 0.682060 | 0.684391 | 0.65 |
| theta | 0.299271 | 0.286084 | 0.323786 | 0.295400 | 0.25 |
| sigma | 0.428679 | 0.426532 | 0.437077 | 0.426086 | 0.40 |
az.summary(fits["NUTS"].idata, var_names=["phi", "theta", "sigma"])
| mean | sd | hdi94_lb | hdi94_ub | ess_bulk | ess_tail | r_hat | mcse_mean | mcse_sd | |
|---|---|---|---|---|---|---|---|---|---|
| phi | 0.689 | 0.075 | 0.55 | 0.82 | 726 | 631 | 1.00 | 0.0028 | 0.0023 |
| theta | 0.298 | 0.092 | 0.13 | 0.47 | 899 | 807 | 1.00 | 0.0031 | 0.0028 |
| sigma | 0.429 | 0.026 | 0.38 | 0.48 | 960 | 916 | 1.00 | 0.00084 | 0.00072 |
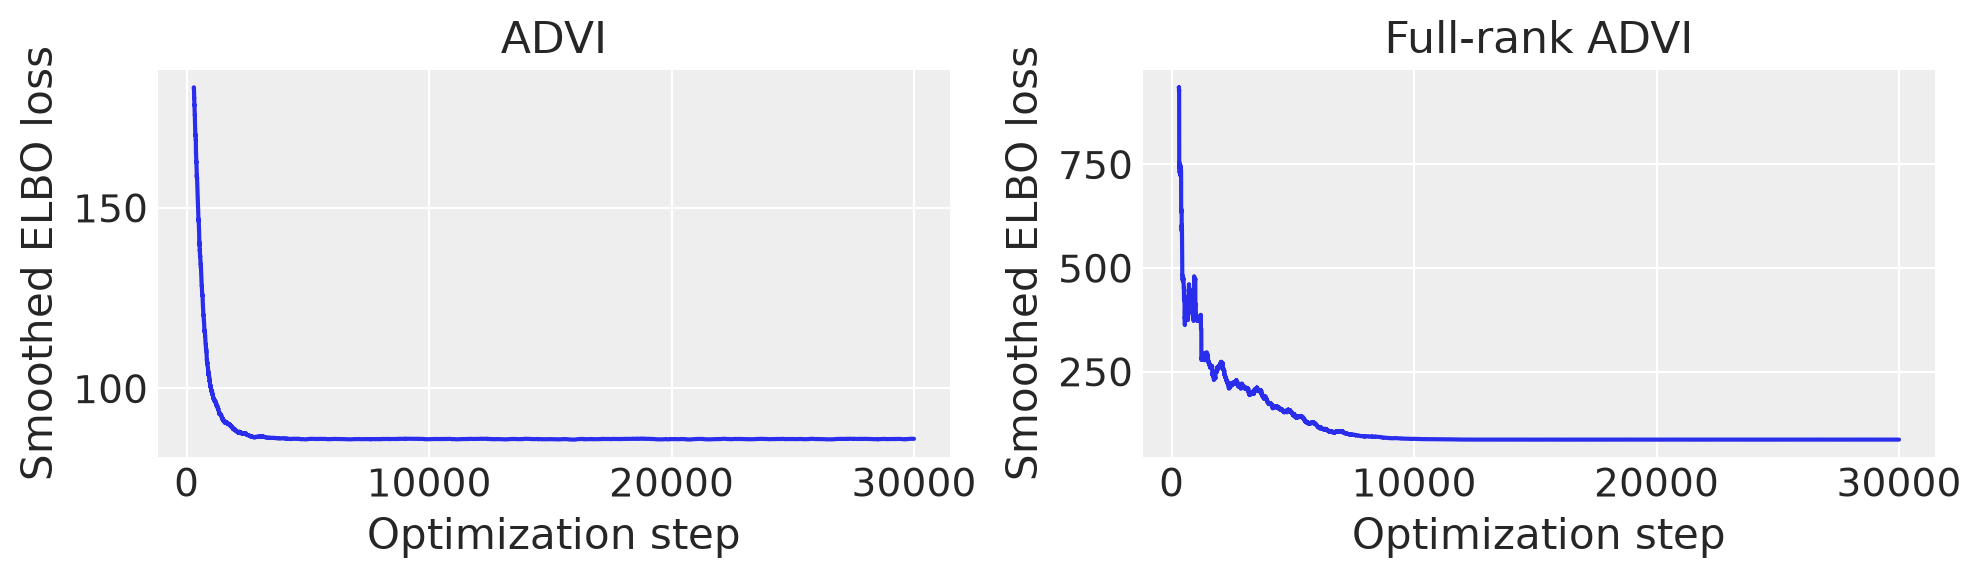
fig, axes = plt.subplots(1, 2, figsize=(10, 3))
for ax, name in zip(axes, ["ADVI", "Full-rank ADVI"], strict=True):
    loss = pd.Series(fits[name].losses)
    loss.rolling(max(5, len(loss) // 100)).mean().plot(ax=ax)
    ax.set(title=name, xlabel="Optimization step", ylabel="Smoothed ELBO loss")
fig.tight_layout()
plt.show()
/var/folders/cm/3dzy9rdd5s3672z0s1brjkvh0000gn/T/ipykernel_69768/2768813796.py:6: UserWarning: The figure layout has changed to tight
  fig.tight_layout()
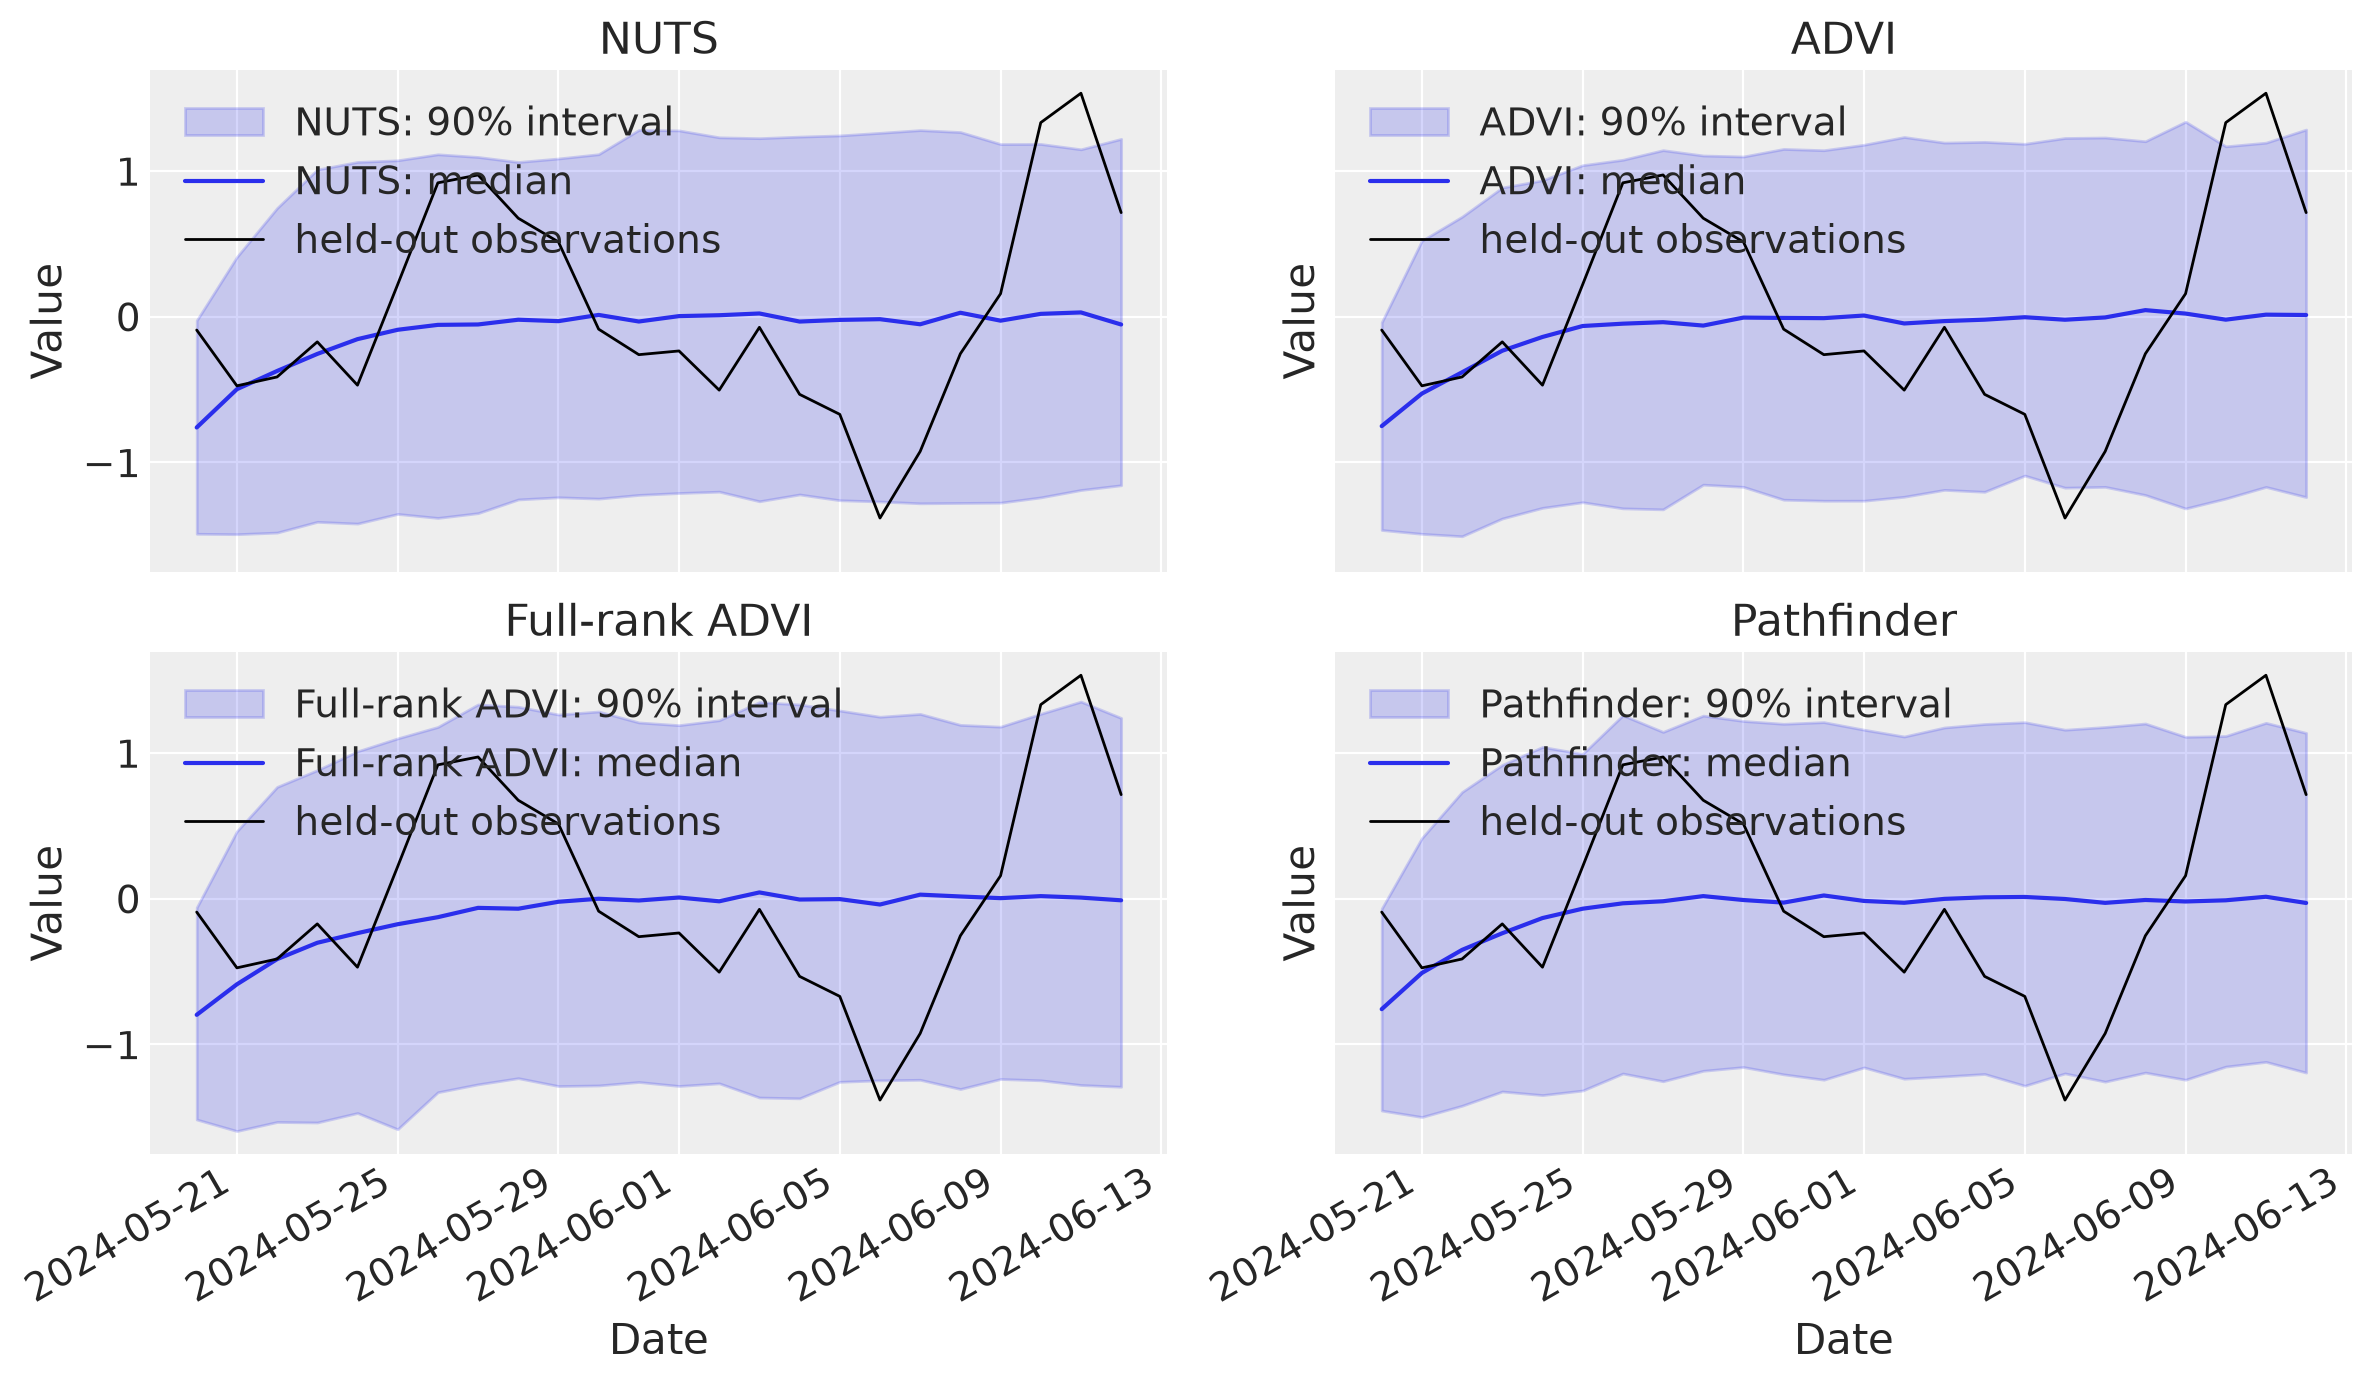
def plot_forecast(ax, samples, truth, label="forecast", color="C0"):
    time = samples.time_future.values
    q = samples.quantile([0.05, 0.5, 0.95], dim=("chain", "draw"))
    ax.fill_between(
        time,
        q.sel(quantile=0.05),
        q.sel(quantile=0.95),
        alpha=0.2,
        color=color,
        label=f"{label}: 90% interval",
    )
    ax.plot(time, q.sel(quantile=0.5), color=color, label=f"{label}: median")
    ax.plot(time, truth.values, color="black", lw=1, label="held-out observations")
    ax.set(xlabel="Date", ylabel="Value")
    ax.legend(loc="upper left")
fig, axes = plt.subplots(2, 2, figsize=(12, 7), sharex=True, sharey=True)
for ax, (name, samples) in zip(axes.flat, forecasts.items(), strict=True):
    plot_forecast(ax, samples, truth, label=name)
    ax.set_title(name)
fig.autofmt_xdate()
fig.tight_layout()
plt.show()
/var/folders/cm/3dzy9rdd5s3672z0s1brjkvh0000gn/T/ipykernel_69768/2079763083.py:6: UserWarning: The figure layout has changed to tight
  fig.tight_layout()
How to use the comparison#
Read predictive scores together with diagnostics and posterior uncertainty. Similar point estimates can hide different interval widths. An unfinished ELBO optimization is not a fair assessment of ADVI; increase its steps or adjust its optimizer if needed. Pathfinder’s importance-sampling diagnostics can also indicate an unreliable approximation.
A single 24-day holdout gives noisy coverage estimates. Use the ARMA backtest to repeat the comparison across forecast origins before choosing an engine for an application. CI smoke outputs only confirm that the workflow executes.